Home / CRYPTOCURRENCY TRADING / INDICATORS AND TOOLS FOR CRYPTO TRADING

Indicators and Tools for Crypto Trading:
Maximizing Profit with the Right Tools
Cryptocurrency trading is fast-paced and dynamic, with markets that can swing drastically within minutes.
To succeed in such a volatile environment, traders must use the right indicators and tools to make informed decisions. Whether you’re a beginner or a seasoned trader, understanding how to leverage these tools can help you identify trends, manage risk, and ultimately boost your trading performance.
In this article, we’ll explore the most effective indicators and tools for crypto trading, their applications, and how to use them to enhance your trading strategy.
1. Why Indicators Are Crucial in Crypto Trading
The cryptocurrency market is known for its volatility, with cryptocurrencies like Bitcoin (BTC), Ethereum (ETH), and others experiencing dramatic price movements.
Without the right indicators and tools, traders may miss out on key opportunities or make trades based on emotions rather than data.
Benefits of Using Indicators and Tools:
- Identify Trends: Indicators help traders spot whether a cryptocurrency is in a bullish or bearish trend.
- Timing Entries and Exits: They provide insight into the best times to enter or exit a trade, potentially increasing profit.
- Risk Management: Tools such as stop-loss and take-profit orders help manage risk by automatically closing trades at predefined levels.
In fact, a 2023 survey by CryptoCompare found that 70% of traders use technical indicators regularly, highlighting their importance in making informed decisions in the crypto market.
2. Most Popular Indicators for Crypto Trading
There are several key technical indicators that traders use to analyze cryptocurrency price movements.
Below are some of the most popular ones:
1. Moving Averages (MA)
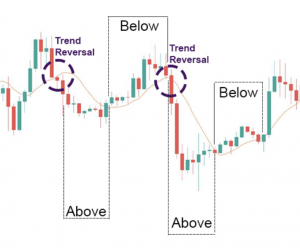
Moving averages smooth out price data to help traders spot trends over a specific period. There are two main types: Simple Moving Average (SMA) and Exponential Moving Average (EMA).
How it Works:
- SMA takes the average of prices over a set period (e.g., 50 days).
- EMA gives more weight to recent prices, making it more sensitive to current market movements.
When to Use:
- Bullish Signals: When the price is above the moving average, it’s generally considered a bullish signal.
- Bearish Signals: When the price is below the moving average, it suggests a bearish trend.
Why It’s Important: Moving averages help traders identify the overall direction of the market and filter out market noise.
2. Relative Strength Index (RSI)
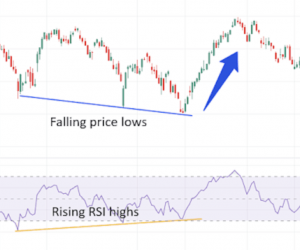
The Relative Strength Index (RSI) is a momentum oscillator that measures the speed and change of price movements. It ranges from 0 to 100 and is typically used to identify whether an asset is overbought or oversold.
How it Works:
- An RSI value above 70 suggests the asset is overbought (potential sell signal).
- An RSI value below 30 suggests the asset is oversold (potential buy signal).
When to Use: RSI is particularly useful for identifying price reversal points. It helps traders avoid entering trades at unfavorable times.
3. Bollinger Bands
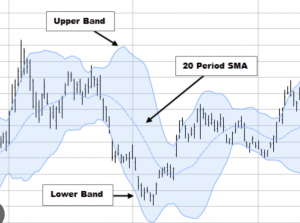
Bollinger Bands are a set of lines that measure the volatility of an asset. The bands expand and contract based on market conditions. The middle band is usually a 20-period moving average, and the upper and lower bands represent standard deviations from the average.
How it Works:
- When the price reaches the upper band, it indicates the asset might be overbought.
- When the price touches the lower band, it might signal that the asset is oversold.
When to Use: Bollinger Bands help traders gauge volatility and potential breakout points.
4. MACD (Moving Average Convergence Divergence)
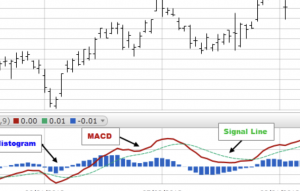
The MACD indicator is used to identify changes in the strength, direction, momentum, and duration of a trend. It is composed of two moving averages: the MACD line (difference between a 12-day EMA and a 26-day EMA) and the signal line (a 9-day EMA of the MACD).
How it Works:
- A bullish crossover occurs when the MACD line crosses above the signal line, suggesting an upward trend.
- A bearish crossover happens when the MACD line crosses below the signal line, indicating a potential downward trend.
When to Use: The MACD is effective for detecting momentum shifts and potential buy/sell signals.
5. Fibonacci Retracement
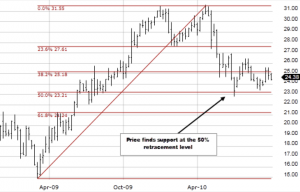
The Fibonacci Retracement tool is used to identify potential support and resistance levels by plotting key levels based on the Fibonacci sequence. These levels are often seen as potential reversal points in the market.
How it Works:
- Traders draw a Fibonacci retracement from the low to the high of a price move, with key levels at 23.6%, 38.2%, 50%, 61.8%, and 100%.
When to Use: Fibonacci retracements help traders identify areas where the price may pull back before continuing in the direction of the prevailing trend.
Binance is a leading global cryptocurrency exchange known for its wide range of trading pairs, low fees, and advanced features for both beginners and professionals.
Coinbase is a popular and user-friendly cryptocurrency exchange that offers secure and easy access to buying, selling, and storing digital assets.
Kraken is a well-established cryptocurrency exchange offering a secure platform with a wide selection of coins and advanced trading tools for all types of traders.
KuCoin is a global crypto exchange providing a wide variety of altcoins, advanced trading features, and competitive fees for users worldwide.
BingX is a global cryptocurrency exchange that offers spot and derivative trading with an intuitive interface and a focus on social trading.
Huobi Global is a leading cryptocurrency exchange that offers a wide range of digital assets and advanced trading tools with a focus on security and liquidity.
OKX is a comprehensive digital asset exchange that provides advanced features like margin trading, futures, and DeFi services with low fees.
Bybit is a popular exchange known for its leveraged trading options and advanced charting tools, tailored for professional cryptocurrency traders.
Gate.io is a global cryptocurrency exchange that offers a wide range of coins, low trading fees, and features like margin and futures trading.
Bitget is a global crypto exchange offering futures and spot trading with an emphasis on user-friendly features and high liquidity.
3. Top Tools for Crypto Traders
While indicators are crucial, the right tools can help traders analyze the market more efficiently and manage trades better. Here are some of the top tools every crypto trader should consider:
1. TradingView
TradingView is one of the most popular charting platforms for traders. It offers a wide range of technical indicators, real-time market data, and customizable charts.
- Features:
- Advanced charting tools and indicators.
- Real-time price updates and news.
- Social features to share ideas and strategies with other traders.
2. CoinMarketCap
CoinMarketCap is a comprehensive cryptocurrency data aggregator. It provides up-to-date information on the prices, market capitalization, trading volume, and historical data of thousands of cryptocurrencies.
- Features:
- Track cryptocurrency prices and market trends in real-time.
- Historical data to analyze price movements.
- Portfolio tracking tools to manage crypto holdings.
3. Binance Trading App
Binance offers a powerful mobile trading app with advanced charting tools, real-time market data, and a user-friendly interface.
- Features:
- Access to spot, futures, and margin trading.
- Real-time price alerts.
- Advanced order types like limit, market, and stop orders.
4. MetaTrader 4 (MT4) and MetaTrader 5 (MT5)
Though primarily known for Forex trading, MetaTrader platforms (MT4 and MT5) can also be used for cryptocurrency trading through brokers that support digital assets.
- Features:
- A wide range of technical analysis tools and indicators.
- Algorithmic trading through Expert Advisors (EAs).
- Automated trade execution and risk management tools.
4. How to Use Indicators and Tools Together
While individual indicators can provide valuable insights, using them in combination is often more effective. Here’s how to combine indicators and tools for a comprehensive trading strategy:
| Indicator/Tool | Purpose | Ideal Combination |
|---|---|---|
| RSI + Moving Averages | Identifying overbought/oversold conditions and trend direction | Combine RSI for momentum signals with moving averages for trend confirmation |
| MACD + Bollinger Bands | Spotting trend reversals and price volatility | Use MACD crossovers for momentum with Bollinger Bands for volatility breakouts |
| Fibonacci + Moving Averages | Identifying key support and resistance levels | Combine Fibonacci retracements with moving averages to identify potential entry and exit points |
5. Conclusion: Mastering Crypto Trading with the Right Tools
The cryptocurrency market is highly volatile, and having the right indicators and tools can make a significant difference in your trading performance.
By combining technical indicators like RSI, MACD, and Moving Averages, with advanced trading platforms like TradingView and CoinMarketCap, you can gain an edge over the market and increase your chances of success.
Remember, while these tools and indicators can provide valuable insights, successful trading also requires a solid understanding of risk management, market sentiment, and disciplined strategy execution.

Author: Alex Turner
Expert in Cryptocurrency Markets & Blockchain Technology
Alex Turner is a seasoned cryptocurrency expert with over 8 years of experience in the digital asset industry.
As a senior market analyst and cryptocurrency strategist, Alex has worked with several leading blockchain companies and financial institutions to develop market insights, trading strategies, and risk management frameworks.
